Market Research
Infrastructure Quarterly: Q2 2026
June 25, 2026 10 Minute Read Time
Introduction
Author
Head of Infrastructure Research

Author
Associate

Private infrastructure investment continues to accelerate despite an uneasy backdrop of a developing conflict in the Middle East. Widening adoption of AI continues to drive expansion in digital infrastructure. However, power segments—from conventional generation to battery energy storage and power grids—are emerging as dominant forces in investment returns, deal flow and sector-specific strategies. Investors eye Europe as a beneficiary of defense and energy transition spending, while the U.S. charges ahead with technological dominance.
Market performance
Infrastructure is a tested inflation hedge
The conflict in the Middle East, particularly disruptions to energy flows through the Strait of Hormuz, has triggered a sharp rise in global oil prices. Energy costs pushed U.S. inflation to 3.8% in April 2026, the highest level since March 2023. The impacts on natural gas prices are more regionally differentiated. Europe and Asia, which rely on seaborne liquified natural gas (LNG) imports, have experienced pronounced price spikes, while North America remains insulated by strong domestic supply.
Private infrastructure continues to deliver consistent returns of around 10%, gross of fees, although performance is reported with a lag (Figure 1). Institutional investors often use inflation and an illiquidity premium as a proxy for required real returns with many employing targets of U.S. consumer price index (CPI) + 400 basis points (bps). The asset class outperformed this target 88% of the time from Q1 2010 to Q4 2025 according to CBRE IM analysis. This resilience is driven by inflation-linked, contracted cash flows that support returns during periods of macroeconomic stress.
Global equities rallied over the past year, on the back of accelerating AI-driven capital expenditure and earnings growth. Listed infrastructure also participated in this rebound, with investor allocation to power and digital assets providing an additional tailwind. In private infrastructure, power generation and utilities led returns on a one-year basis with total returns of 23% and 15%, respectively. The performance of digital infrastructure has started to moderate towards a long-term return profile of 12%–13%.
Figure 1: Infrastructure, bonds and equities, annualized total returns, %
Rising geopolitical uncertainty and a fragile macroeconomic backdrop highlight the importance of understanding how asset classes respond to key economic drivers and energy prices. Private infrastructure stands out, showing the strongest correlation with inflation and natural gas prices at 0.4 and 0.3, respectively (Figure 2). Private infrastructure also exhibits a positive relationship with economic growth similar to public equities. This is largely because while infrastructure assets provide essential services, some sectors’ cash flows are volume-driven, and infrastructure overall strongly benefits from structural tailwinds.
Figure 2: Correlation of returns with U.S. inflation, U.S. GDP and natural gas prices, year-over-year (Y-o-Y) changes
A slow start to fundraising
Infrastructure fundraising approached $30 billion in Q1 2026 based on final closes (Figure 3), a slow start to the year following recent record high levels in 2025. Timelines continue to improve as the time to final close declined to under 26 months. Europe led fundraising in the quarter, buoyed by investor preference for regulatory stability, however most funds in the market still follow a multiregional strategy. At the sector level, renewables, power and transmission strategies expanded significantly, accounting for a combined 87% of sector-specific fundraising, a notable increase from previous years. This growth reflects the role of power capacity as foundational to the energy transition and AI adoption.
Figure 3: Infrastructure fundraising, in $ billions
Redemptions from semi-liquid private debt funds amid investor concerns about the prospects of software-as-a-service companies dominated Q1 2026 headlines. S&P Global highlights growing vulnerabilities in private credit markets, including rising leverage, refinancing pressures and liquidity mismatches.
Infrastructure debt has structural differences compared to broader private corporate credit; its collateral support and cash flow visibility provide a buffer against macroeconomic pressures, reinforcing its appeal as a defensive credit allocation. From a strategy perspective, infrastructure debt is a small allocation within the infrastructure asset class, with assets under management (AUM) contained at about 10%–11% of the total (Figure 4).
Figure 4: Infrastructure and infrastructure debt AUM, in $ billions
Deals
Race for scalable, flexible power
Private infrastructure investment reached a new peak of approximately $330 billion in closed transactions led by North America (Figure 5a). The U.S. accounted for 97% of regional volumes, underpinned by hyperscaler capital expenditure and the build-out of power and digital infrastructure. At the sector level, power expanded its share of global deal activity by nine percentage points globally (Figure 5b).
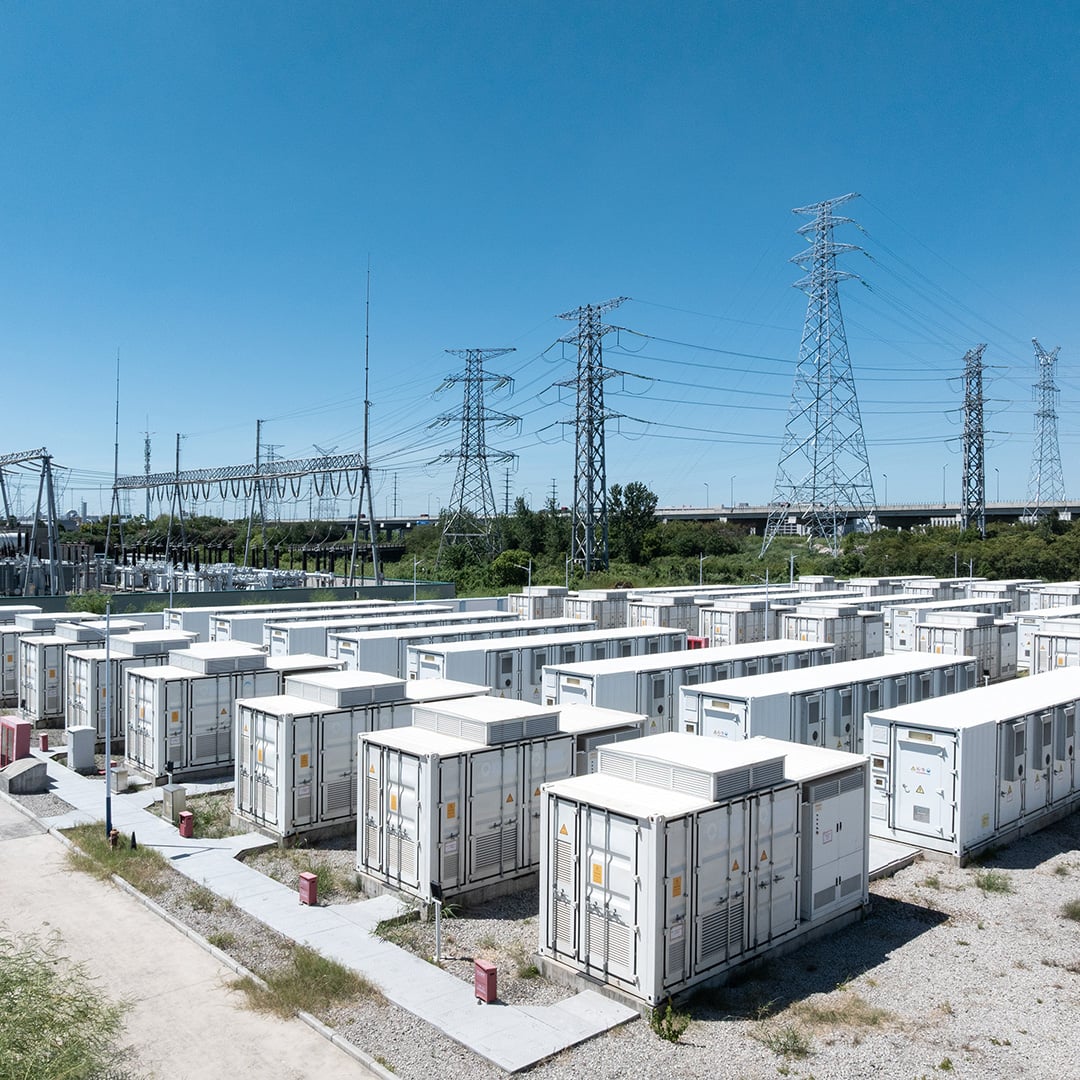
Capital is historically concentrated in energy assets but increasingly gravitates towards scalable, contracted power solutions including natural gas and battery energy storage systems (BESS). Recent large-scale transactions highlight investor appetite. Constellation Energy’s $26.6 billion acquisition of Calpine creates one of the largest U.S. power producers, combining natural gas, nuclear and renewable generation. In addition, Intersect Power’s Darden Clean Energy Project pairs 1 gigawatt (GW) of solar power with up to 4.6 GW of battery storage, positioning it among the largest BESS projects globally.
Figure 5a: Private infrastructure investments by region, in $ billions
Figure 5b: Private infrastructure investments by sector, %
Battery deployment has grown six-fold since 2020 according to the International Energy Agency (IEA). Battery energy storage is becoming a critical enabler of renewable energy integration as intermittency intensifies. The global battery market is expected to exceed $150 billion in 2025, representing 20% Y-o-Y growth, with storage accounting for an increasing share. Annual capacity additions surpassed 100 GW in 2025, marking a 40% increase Y-o-Y (Figure 6). Utility-scale projects account for the majority of new deployments, a rapid scale-up of storage as a core grid asset.
Figure 6: Global battery energy storage capacity additions, 2020-2025, in GW
Q&A
Q&A with Caroline Mead, Senior Vice President of Power Marketing at ENGIE North America
Caroline Mead, Senior Vice President of Power Marketing at ENGIE North America, shares her perspective on the growing role of BESS in enhancing grid flexibility, enabling renewable integration and capturing value across evolving U.S. power markets. CBRE Investment Management has partnered with ENGIE North on a portfolio of battery storage projects operating across Texas and California.

What are the critical success factors for battery energy storage in North America?
Battery energy storage systems are attractive in North American power markets because they provide highly flexible, low-marginal-cost capacity that can respond instantly to changing system conditions. BESS creates value across the full market cycle, charging during periods of oversupply and low prices, and discharging when the system is tight and prices rise. During scarcity events, batteries play an especially important role by delivering fast, reliable peaking support exactly when the grid needs it most. ENGIE’s focus is on maximizing operational availability and market positioning through a deep understanding of supply-demand dynamics, enabling battery assets to capture arbitrage opportunities and deliver meaningful value, particularly during periods of system stress.
How do batteries contribute to grid stability?
As renewable generation increases across the U.S. power grid, batteries are playing an increasingly important role in maintaining grid stability because they can respond in milliseconds to changing system conditions. ENGIE places significant emphasis on understanding and forecasting nodal pricing, congestion, transmission constraints and how batteries, data centers and other large loads shape overall grid performance. While the U.S. system generally has adequate energy capacity, it often faces shortages of flexible peaking capacity during scarcity hours, an area where batteries are especially well positioned to create value. As market rules continue to evolve, many Independent System Operators (ISOs) are becoming more comfortable granting capacity accreditation to battery storage, further strengthening its role in the resource mix. ENGIE also sees BESS as essential to improving transmission efficiency, supporting the integration of inverter-based resources and enhancing long-term system reliability.
What are the implications of scaling AI compute on North American power demand?
As AI-driven data center demand scales across North America, power cost is becoming an increasingly important determinant of competitiveness, often representing a substantial share of variable operating costs. From ENGIE’s perspective, BESS is economically attractive relative to many behind-the-meter alternatives because it operates with opportunity cost rather than variable fuel cost, while also enabling both daily and seasonal arbitrage in power markets. Batteries can help support rising load growth by improving system flexibility, reducing stress during tight market conditions and enhancing the efficiency of power delivery to large demand centers. Looking ahead, the market will require significantly more storage capacity to preserve competitive marginal power costs as AI-driven electricity demand continues to expand.
Sector insights
Power and utilities
The U.S. is entering a period of power capacity expansion, driven by accelerating demand from data centers, electric vehicles (EV) and broader electrification. After roughly 15 years of flat power consumption, U.S. power demand has resumed growth, at an average 2.1% per year over the last five years, according to the U.S. Energy Information Administration (EIA). Total installed generation capacity may need to increase by 50% to 90% by 2050 to meet this demand.
The pace and composition of the power generation build-out will be shaped by competing forces, including declining renewable costs, natural gas availability, evolving federal policy and the relentless power appetite of AI. Natural gas and renewables will jointly lead the build-out, although the balance between them remains contested. Solar and wind will expand significantly, with solar capacity projected to more than double by 2050 (Figure 7).
Under the zero-carbon low-cost case, declining technology costs accelerate renewables deployment, reducing reliance on natural gas for new capacity additions. In a high-cost scenario, where costs are held at 2025 levels, natural gas remains the primary dispatchable resource. Across both scenarios, natural gas is likely to complement intermittent renewables, as AI-driven data centers and other high-load users require consistent, around-the-clock power.
Figure 7: Energy capacity additions (retirements) across modeled cases 2025–2050, in GW
Renewables
The conflict in the Middle East has returned energy security to the top of Europe's political agenda. The conflict echoes the urgency of the beginning of the Russia–Ukraine war in 2022, when surging energy prices forced governments to diversify away from fossil fuel imports. This time, however, Europe enters the crisis from a position of greater resilience supported by sustained expansion of wind, solar and storage capacity that has reduced its vulnerability to commodity price shocks.
Grid-scale storage is a key enabler of the energy transition. Average global energy storage prices in 2025 declined to roughly one-third of 2020 levels, improving project economics (Figure 8). The investment case is strongest when revenue is drawn from multiple sources: grid services, wholesale arbitrage and capacity payments. Policy incentives, including the U.S. Investment Tax Credit and accelerated depreciation, meaningfully enhance returns for renewables and support deployment of technologies.
The Middle East conflict introduces near-term lithium-ion battery cost pressures. Disruptions to the Strait of Hormuz shipping have affected supplies of aluminium, copper and sulfuric acid, which are all critical battery manufacturing inputs. Aluminium prices have risen to a four-year high. The impact on battery costs will depend on the duration and scale of the conflict and its consequences for petrochemical supply chains.
Figure 8: Average lithium-ion battery pack price per watt-hour index by application, 2022–2025
Digital infrastructure
Hyperscaler capital expenditure continues its steep ascent, with major technology companies expected to reach approximately $730 billion of investment in 2026 (Figure 9). For comparison, this figure stood at $670 billion at the start of the year, a hefty 10% increase in less than six months. The capital investment is driven largely by pre-leased demand and visible client commitments through record backlogs rather than speculative build.
Figure 9: Capital expenditure at major tech companies, in $ billions
Future data centers will likely be shaped by quantum compute. Fault-tolerant quantum systems capable of operating at commercial scale are anticipated between 2028 and 2030, with global investment already exceeding $55 billion. Quantum computing could generate up to $2.7 trillion in value by 2035 (Figure 10), with impacts concentrated in chemicals, financial services and travel, transport and logistics.1
Figure 10: Value to key segments from quantum computing, in $ billions
Quantum compute will complement rather than replace the demand for classic data center infrastructure. AI will manage inference and system orchestration, while quantum compute will be applied to the most computationally complex problem sets. However, meaningful deployment of quantum compute faces significant challenges. Quantum systems remain bulky, fragile and highly specialized, with each modality requiring distinct power, cooling and environmental conditions, and no universal standard has yet been established.
Transport
Transport infrastructure is facing disruption from geopolitical events. In April 2026, air passenger traffic contracted 3.4% Y-o-Y, driven primarily by the Middle East conflict (Figure 11). Other regions continued to expand, with year-to-date traffic still up as of April 2026, indicating disruption remains geographically concentrated rather than structural. Rising oil prices are amplifying cost pressures for airlines, with jet fuel prices raising airfares across key international routes.
Figure 11: Air passenger traffic trends year to date, in revenue passenger kilometres (RPK)
EV adoption continues to increase, reducing some parts of the global economy’s exposure to oil price volatility. EVs and plug-in hybrids now account for approximately 25% of global new car sales, exceeding 20 million units in 2025 and displacing an estimated 1.2 million barrels of oil per day. Countries with higher adoption rates are proving more insulated from oil price shocks: China leads with EVs representing more than half its domestic car sales, followed by Europe, at just over 25%, according to the IEA.
Public charging infrastructure is essential for expanding EV adoption, especially for drivers without access to home charging. Global public charging stock surpassed 7 million charging points in 2025, growing 33% Y-o-Y and keeping pace with fleet growth. Fast and ultra-fast chargers are expanding rapidly, but access remains limited in urban areas without home charging. Addressing this gap will require investments in fast-charging networks and improved reliability to support broader EV adoption.
Conclusion
Geopolitical conflicts introduce near-term volatility across key sectors in infrastructure, but structural tailwinds remain firmly intact. AI is accelerating both the demand for new power generation and the transformation of digital infrastructure, while the electrification of transport is creating new investment opportunities at pace. Balancing near-term geopolitical risks with the long-term growth potential of these themes will capture resilient returns.