Market Research
Chart of the Week
October 7, 2026

Chart of the Week highlights economic data and commentary from our Insights & Intelligence and Investment teams on the market trends of the day.
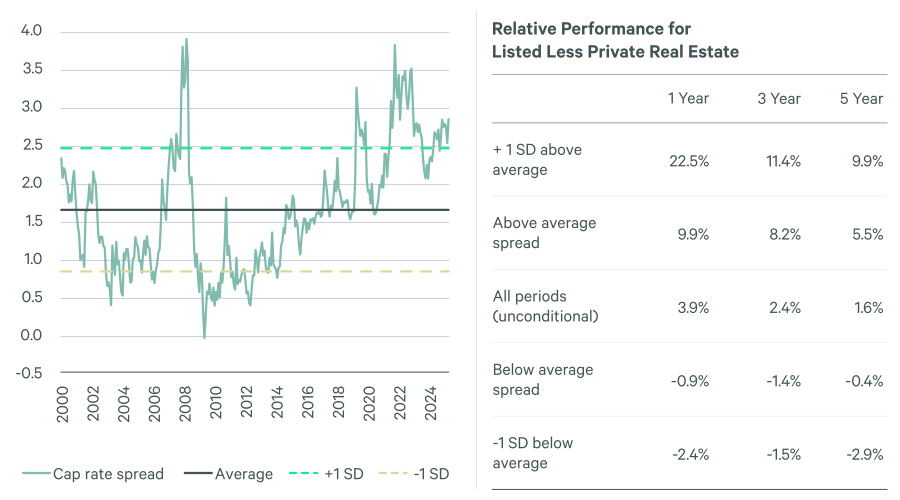
This week’s chart highlights the historical link between listed real estate relative valuations and future relative performance. When the listed-private cap rate spread has been above its long-term average, listed real estate has outperformed private real estate over subsequent one-, three- and five-year periods. We believe listed real estate remains attractively valued relative to private markets and may be positioned for continued relative outperformance. Learn more in our Listed Outlook Commentary series.
General Disclosures
Past performance is not indicative of future results. The value of investments and the income from them can go down as well as up and an investor may not get back the amount invested. These investments are designed for investors who understand and are willing to accept these risks. Performance may be volatile, and an investor could lose all or a substantial portion of its investment. Prior to investing in an investment vehicle, prospective investors should consult with their own investment, accounting, regulatory, tax and other advisors as to the consequences of an investment in the investment vehicle.
This presentation (this “Presentation”) has been prepared for a limited number of qualified investors, is provided for informational purposes only, and does not constitute an offer to sell or a solicitation of an offer to purchase any security in any investment vehicle managed by CBRE Investment Management. Such solicitations can only be made to qualified investors by means of a private placement memorandum or prospectus (the “Memorandum”), which describes, among other things, the risks of making an investment as well as other important information about the investment vehicle and its manager. Additionally, this Presentation does not constitute investment advice of any kind.
By accepting the Presentation, you agree to treat it in a confidential manner and to not disclose it to anyone except to (i) your legal, tax and financial advisors who agree to maintain these materials in confidence, or (ii) a governmental official upon request, if entitled to such information pursuant to a judicial or governmental order. This information may not be reproduced, used or disclosed, in whole or in part, without the prior written consent of CBRE Investment Management.
The information contained herein is given as of the date of this Presentation, unless indicated otherwise. CBRE Investment Management has not made any representation or warranty, express or implied, with respect to the fairness, correctness, accuracy, reasonableness or completeness of any of the information contained herein (including but not limited to information obtained from third parties), and they expressly disclaim any responsibility or liability therefore. CBRE Investment Management does not have any responsibility to update or correct any of the information provided in this Presentation. Certain assumptions may have been made in the analysis which resulted in any information and returns/results detailed herein. No representation is made that any results/returns indicated will be achieved or that all assumptions in achieving these returns have been considered or stated. Additional information is available on request. Opinions and estimates offered constitute our judgment and are subject to change without notice, as are statements of financial market trends, which are based on market conditions. Unless otherwise indicated, figures presented are preliminary, unaudited, subject to change and do not constitute CBRE Investment Management’s standard books and records.
Statements contained in this Presentation that are not historical facts are based on current expectations, estimates, projections, opinions and beliefs of the investment vehicle’s manager. Such statements involve known and unknown risks, uncertainties and other factors, and undue reliance should not be placed thereon. Additionally, this Presentation contains “forward looking statements.” Actual events or results or the actual performance of any investment vehicle may differ materially from those reflected or contemplated in such forward looking statements.
Certain economic market and other information contained herein has been obtained from published sources prepared by third parties and in certain cases has not been updated through the date hereof. Neither CBRE Investment Management, any investment vehicle, nor their respective affiliates nor any of their respective employees or agents assume any responsibility for the accuracy or completeness of such information.