Future of Real Assets is Today
Infrastructure for Tomorrow: Rising Above a Wall of Worry
December 5, 2025 8 Minute Read Time

Introduction
Author
Senior Director, Portfolio Strategist

Author
Chief Investment Officer – Listed Infrastructure

Prefer a PDF?
As investors turn to face the strain of tomorrow’s markets, we see infrastructure as a compelling solution. In our conversations, investors are concerned about:
- A path to profitable generative-AI growth
- The prospects of slowing economic growth and persistent inflation
- The ability to enhance both traditional and private portfolios while positioning for outperformance
We see infrastructure as a solution. We see infrastructure as a defensively positioned earnings stream that is accessible at attractive valuations, where earnings growth for approximately 60% of our universe is enhanced by AI themes. Infrastructure, which has offered resilient cash flows across market cycles, has historically outperformed during periods of slowing growth and persistent inflation. From a portfolio perspective, we see allocations to listed infrastructure as enhancing both traditional and private portfolios. In this paper, we review our outlook for infrastructure and its role in a portfolio.
Infrastructure and the prospects of an AI bubble
Generative AI (Gen AI) has been the dominant market force over the past 2.5 years. It has driven higher market valuations, transformed the outlook for industries, and contributed to a softening labor market. Gen AI has also led to a surge in AI-related infrastructure investment and power demand. As the ultimate revenue potential of Gen AI remains unclear and major technology companies have announced large capital expenditures, concerns over an AI bubble and related party circularity have risen.
Infrastructure offers the potential to de-risk portfolios that are now likely more weighted toward more expensive or transactional AI beneficiaries. Accelerated growth from Gen AI in infrastructure is regulated and contracted; it can be potentially resilient if the pace of development slows. As an example, when listed utilities raise their growth rates due to expected power demand from data centers, as several did over the course of 2025, it is after careful de-risking of customer build plans and approvals from public regulators. As we consider our forward growth expectations, we see the magnitude of measured, conservative utility budgets to potentially deliver EPS growth above the high end of the sector’s historical ranges.
Rising public utility growth forecasts are heavily risked; investment trends suggest higher growth in the future

Relative valuations in infrastructure
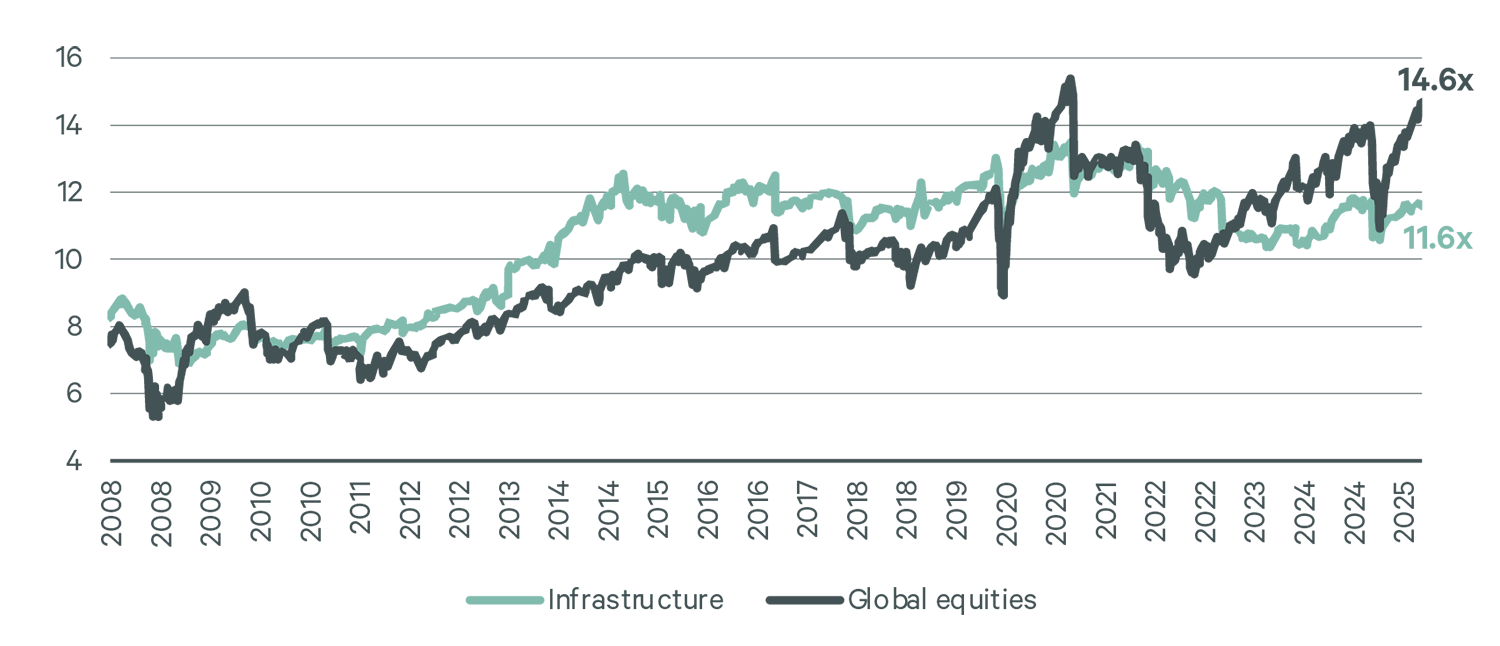
The starting point for infrastructure—valuations—should not be ignored. While infrastructure has performed well in 2025, it has underperformed broad equities. Currently, infrastructure stands at a 20%+ discount to broad equities compared to its historical ~7% premium. The absolute multiple is also attractive, trading at the same level as a decade prior. The potential for multiple recovery is a key pillar in our expectation for infrastructure to deliver double digit annualized returns when looking ahead.
Infrastructure remains attractively valued relative to global equities
EV/EBITDA | Global infrastructure vs. global equities
Relative earnings multiple | Global infrastructure vs. global equities

Resilient growth amid persistent inflation
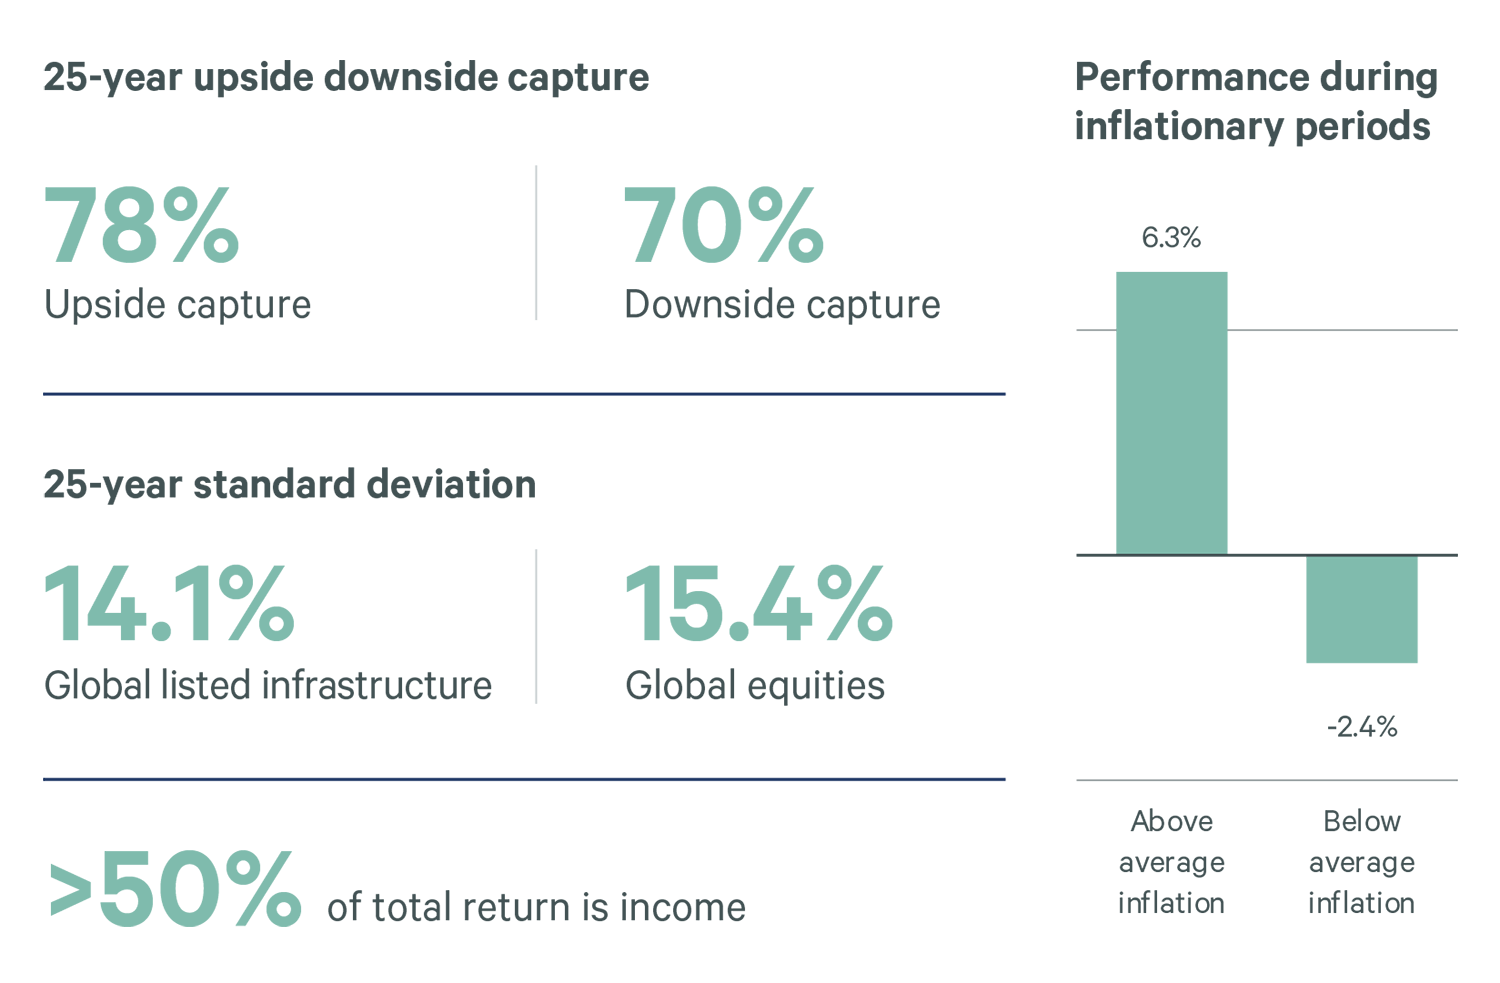
In an environment of potentially moderating economic growth and persistent inflation, infrastructure can be a valued contributor to growth in a portfolio. Historically, infrastructure’s resilient cash flows and income have led to both upside capture during higher growth periods as well as relative strength when market conditions are challenged. Infrastructure’s regulated and contracted inflationary trackers have also led to annualized performance during higher inflation periods. Below, we review these key characteristics of infrastructure compared to broad equities: upside capture, downside protection and performance during inflationary periods.
Key asset class characteristics for infrastructure
Portfolio blending with broad equities and private markets
Given the set of characteristics referenced, the blending of infrastructure into traditional portfolios has made strategic sense—infrastructure has increased return, lowered volatility/beta, and improved portfolio resiliency. We believe the opportunity today is tactically enhanced by relative valuations and the accelerating earnings growth that our companies are seeing.
Infrastructure and traditional portfolios: enhancing return, lowering risk

We are also seeing the use of listed infrastructure alongside private infrastructure. Listed offers the potential for immediate access, the liquidity to dynamically manage an allocation and the potential for enhanced risk-adjusted returns. Our CBRE IM listed infrastructure universe, aligned with a private market view of infrastructure, comprises over 300 companies and $4.5 trillion of market capitalization. Investors can access this market as a complement to a pending call from a private infrastructure closed-end fund or an open-end fund with a queue.
Listed and private infrastructure: a complementary combination with the potential to:
- Enhance risk-adjusted returns (Sharpe ratio)
- Enhance the ability to target assets (e.g. regulated utilities, airports, toll roads)
- Provide immediate access and liquidity
- For a full discussion of listed and private infrastructure, please see “Listed infrastructure: A solution for policy benchmarks and investor portfolios” May 2025.”
Positioning for outperformance
As we look ahead to 2026, we have positioned our portfolio for global, developed market infrastructure exposures. In utilities, we are targeting companies that can monetize load growth opportunities arising from generative AI and companies that have increased manufacturing and electrification capacity within their territory. We seek a balance across regulatory jurisdictions, with a keen eye toward countries and/or U.S. states where regulation supports investment and affordability and economic prospects are strong. Within global toll roads, we’ve seen consistent pricing increases across marquee assets, and we believe our holdings are positioned to prosper in an environment of sustained inflation. We continue to maintain exposure to data centers, contracted power generation and midstream energy markets, while mindful of opportunities to enhance risk-adjusted returns.
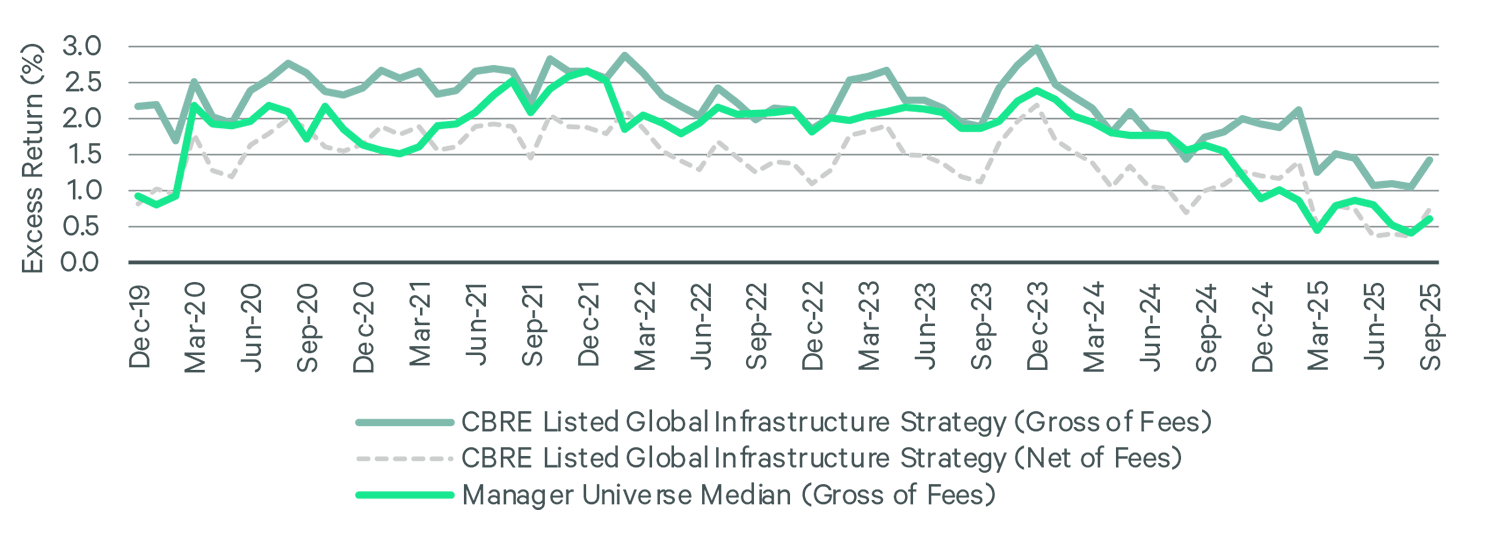
For over a decade, our team has managed listed infrastructure aligned to a private market view and with a goal of consistent, strong risk-adjusted returns. We find value in managing a niche asset class, underfollowed by generalists, where managers can maintain an information edge. A defining output of our platform has been consistency relative to infrastructure peers. We show this below in terms of our 5-year rolling outperformance compared to passive options and the returns of our flagship listed infrastructure strategy over time. As we position for the infrastructure of tomorrow, we look forward to enhancing returns and climbing the wall of worry for investors.
Rolling and trailing returns: CBRE Investment Management and peers
CBRE Listed Global Infrastructure Strategy

Industry 5-year rolling outperformance