Market Research
The European Office Opportunity: Investing in a Bifurcating Market
November 19, 2026 5 Minute Read Time

Introduction
Author
Associate, Research

European office has bifurcated into two distinct asset classes that happen to share a sector label. Modern, well-specified, energy-compliant office is delivering strong occupier demand, rental growth and a compelling five-year return outlook. Older, non-compliant stock faces a converging set of pressures, from regulatory deadlines and occupier sustainability procurement requirements to a widening rent and yield spread relative to prime—and it is repricing faster than broad market-level data suggests.
This bifurcation is contributing to a structural shift in how occupiers make decisions, with implications for the rest of the market:
- Genuinely prime, certified space generates a performance premium
- Rent and yield spreads between prime and secondary have widened
- Approaching energy efficiency compliance deadlines are accelerating the repricing
- Investors must determine the relative merits of repositioning non-compliant stock versus acquiring prime outright
Throughout this paper, references to “office” denote modern, specification-compliant space unless otherwise stated. “Prime” refers to assets and submarkets that meet current occupier specification and command top-quartile rents; “secondary” refers to stock falling short of those thresholds.
What constitutes modern
“Modern office” is best defined by the four criteria that consistently factor into occupier decision-making and have a direct bearing on an asset's ability to command and sustain prime rents.
- Energy performance and sustainability certification: BREEAM Excellent or Outstanding and LEED Platinum or Gold are no longer differentiators in the most competitive submarkets—they are entry requirements. In the most active leasing markets, occupier procurement processes now screen for certification at the outset and tightening regulatory minimum standards are converting what was once a voluntary premium into a legal floor.
- Floorplate efficiency and technical specification: Modern offices need column-free or low-column floors, raised access floors allowing flexible servicing, high floor-to-ceiling heights, smart building management systems and genuine technical adaptability for hybrid working configurations.
- In-building amenities: The quality of the environment within the building is improved with food and beverage options, wellness facilities, cycle infrastructure, electric vehicle (EV) charging and building-level technology provision.
- Local amenities: The quality of the surrounding neighborhood is measured by transport connectivity, retail and restaurant offerings, and the general public realm.
This paper focuses most on energy performance and sustainability certification because it is highly quantifiable, carries growing legal weight and is becoming a common filter in occupier procurement.
Drivers of premium performance
Modern European office space faces acutely constrained supply, concentrated occupier demand and a widening vacancy differential between prime and peripheral stock, all of which underpin the outlook for premium performance of the asset class.
CBRE Investment Management’s H2 2026 House View forecasts that modern European office assets will deliver a 6.6% total annual return over the five-year period to Q3 2031, while the U.K. is expected to deliver 7.5% per annum (p.a.) over the same period. These forecasts compare favorably with our all-property return forecasts of 6.3% p.a. for Europe and 7.0% p.a. for the U.K.1
Strong prime rental growth remains concentrated in the most constrained, highest-quality submarkets. Notable examples of recent annual rent growth in Q2 2026 include London City (+12%) and London West End (+18%).2 Robust occupier demand that shows no sign of broadening down the quality curve is contributing to this growth.
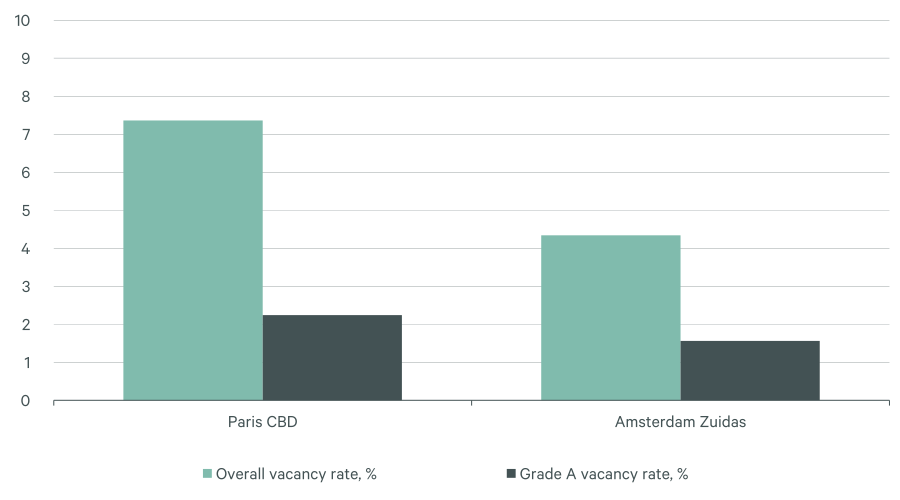
The performance outlook is structurally underpinned by a severe supply shortage. Office construction starts across Europe are down 80% from their recent peak, the steepest contraction of any major real estate sector.3 In London's West End, Amsterdam Zuidas and key German central business districts (CBD) submarkets, Grade A stock under five years old has fallen below 3% of total inventory, creating scarcity in precisely the product occupiers are targeting. Grade A vacancy across core submarkets has remained at structurally low levels even as vacancy in secondary and peripheral stock has risen, widening the prime-secondary performance gap. One example is Paris, where the vacancy in prime Paris CBD Grade A was just over 2.2% in Q2 2026 versus Paris CBD peripheral at 7.4% (Figure 1).2
Figure 1: Offices: Grade A vacancy vs. peripheral vacancy, Q2 2026, %
Assessing the repositioning opportunity
The repositioning opportunity examined here is specific: the acquisition of secondary office stock—assets falling short of occupier specification or regulatory compliance requirements—and their upgrade to prime-grade through refurbishment. This is distinct from repurposing to alternative use. Two forces make the investment case: a widening rent, vacancy and capital value spread between prime and secondary, which frames the return available from a successful repositioning; and an accelerating regulatory compliance cliff, which is repricing unimproved stock and creating the entry point.
The assets described as “prime” throughout this section meet the specification criteria set out in the Introduction: energy-compliant, technically specified and commanding rents at the top of their submarket. “Secondary” denotes stock that falls short of one or more of those criteria.
Widening prime-secondary spread
The spread between prime and secondary office across rent, vacancy and capital value continues to widen across European markets.
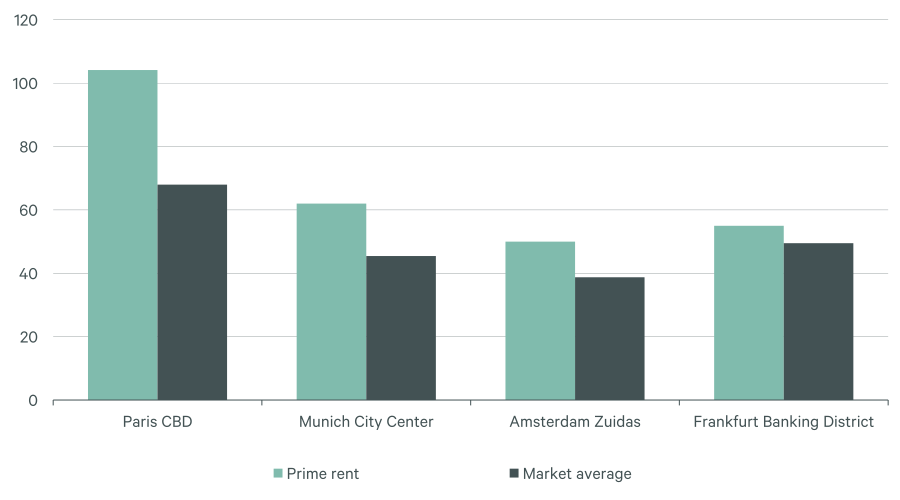
In Q2 2026, Paris CBD prime rents reached €104 per square meter per month versus average rents at €68 per square meter per month, while in Munich where prime rents reached €62 per square meter per month versus average rents at €45 per square meter per month (Figure 2).2 Similarly in London, CBRE Q2 2026 data reveals that prime rents reached £200 per square foot p.a. in the West End and £95 per square foot p.a. in the City,4 levels sustained exclusively by demand for best-in-class, specification-compliant space.
Analysis by Savills shows that in H1 2026, office buildings with a BREEAM certification of Excellent or Outstanding commanded average rents that were 49% higher than non-rated buildings in the West End and 39% higher in the City.5 In contrast, average rents for Grade B assets continue to soften in the City by 2.6% year-over-year (Y-o-Y) and in the West End by 11.3% over the same period.5
The bifurcation is also clear in recent leasing activity: Grade A space accounted for 92% of all Central London office transactions in Q1 2026,6 while secondary and substandard stock see rising vacancy rates. Occupiers are not compromising on specifications and secondary landlords are rebasing or withdrawing from space that cannot meet current occupier mandates. This demand for specification-compliant space has made corporate occupier office fit-out the second most active construction sector across Europe, behind only data centers.7
Submarket nuances are notable in London, particularly between the West End and the City, and will impact the individual repositioning opportunities. In the City, older large-floorplate buildings dominate secondary stock and face the steepest occupier downgrade pressure. Repositioning these assets to prime specification requires deeper structural intervention and higher absolute capex, but the rent uplift from pre- to post-refurbishment reflects a market where tenants will pay a material premium for quality over a wide range of secondary stock. The market for West End’s secondary assets is more granular and, in core locations, the West End benefits from near-zero new supply with no significant new Grade A supply expected until Q3 2027.
Figure 2: Rents: prime vs. secondary, Q2 2026, € per square meter per month
Regulatory compliance liability
The compliance liability embedded in secondary office stock is a primary reason the prime-secondary spread persists: repositioning requires capital, technical expertise and an operational capability that sits outside the mandate or investment approach of many institutional buyers. The spread is not a mispricing—it reflects a structural narrowing of the pool of investors positioned to act on it (Figure 3).
Figure 3: Regulatory compliance timeline, office buildings
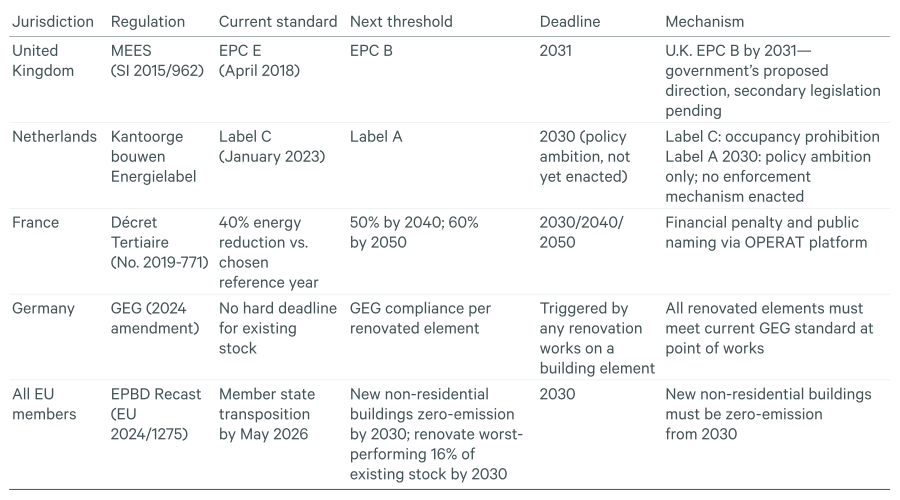
The Netherlands has already experienced the compliance event the other markets are approaching. Since Label C became an occupancy prohibition in January 2023, the structural consequence has been clear: compliant, investable stock contracts sharply, and buyer appetite for non-compliant buildings narrows to conversion specialists. By early 2025, one in five Amsterdam office buildings still failed to meet the mandatory Label C requirement, with enforcement actions already underway against non-compliant owners. London and Paris face the same inflection point—and from a tighter supply base—as MEES (Minimum Energy Efficiency Standards) and the EPBD (Energy Performance of Buildings Directive) approach their respective deadlines.8
Impact of energy efficiency compliance: London case study
London data provides the most granular available evidence on the compliance-driven supply gap that is underway in other markets in Europe. Using the MHCLG Non-Domestic EPC Register (the U.K. government’s official database of commercial building energy performance certificates, maintained under MEES), we can attempt to quantify the contracting pool of investable assets, the repricing of non-compliant stock and the widening gap between compliant and non-compliant stock ahead of each regulatory deadline.
We analyzed 3,322 unique office properties9 across the City of London10 and prime West End submarkets,11 using certificates lodged between 2023 and 2026 and de-duplicated to the most recent assessment per property. Our findings reveal that compliance positioning varies meaningfully between the two markets, reflecting differences in building stock character and floorplate scale.
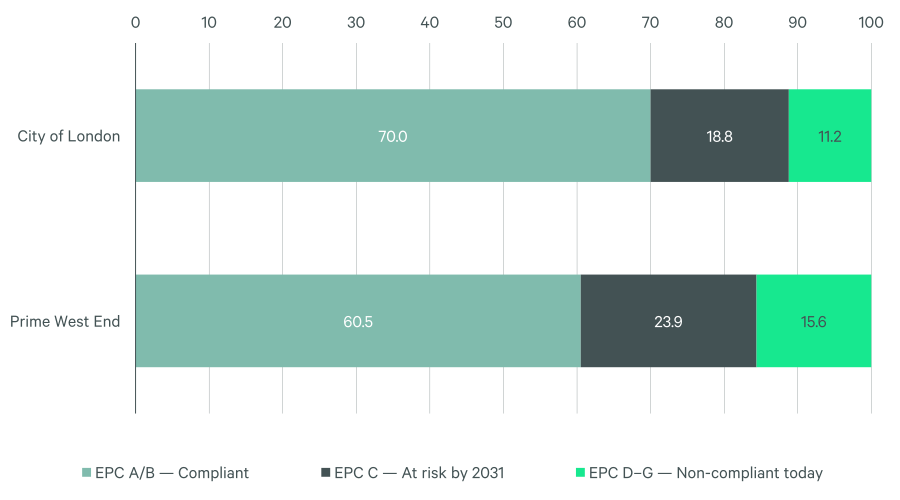
In the City of London, 70.0% of assessed properties hold EPC (Energy Performance Certificate) ratings of A or B, which are compliant under current MEES requirements and the proposed 2031 EPC B threshold (Figure 4). A further 18.8% hold EPC C, which are legally compliant today, but face a material compliance event if the threshold is enacted. The remaining 11.2% (76 properties) are rated D or below, with those rated E, F or G already restricted or unlawful to let on new lease terms under current MEES; D-rated stock remains lawful today but faces the most acute compliance risk if the 2031 threshold is enacted.
The average floor area of EPC D-rated City stock is 3,517 square meters and E-rated stock 1,668 square meters, substantially below the 6,633-square-meter average for EPC B buildings. D-rated stock is the most compliance-challenged in the City stock, while also the most granular and least economic to reposition. The options for owners are limited: retrofit, convert to alternative use or accept a material discount on a disposal to a buyer willing to take on the liability.
The prime West End presents a more pronounced picture. Of 2,646 assessed properties across the core submarkets of Mayfair, St James’s, Oxford Street, Marylebone and Soho/Fitzrovia, 23.9% hold EPC C and 15.6% (414 properties) are rated D or below, with E-, F- and G-rated stock already unlawful to let. D-rated stock faces the 2031 compliance cliff if secondary legislation passes. In absolute terms, 632 properties sit in this combined at-risk category, reflecting the character of its building stock. The average floor area is just 563 square meters for D-rated properties, which is half that of EPC B buildings; retrofit economics are rarely viable, making conversion or stranding the more likely outcome and further compressing the supply of investable stock.
Across both the City and West End markets, 490 properties representing approximately 562,000 square meters of office floor space are already unlawful to let under current MEES—effectively stranding assets in one of the most supply-constrained submarkets in Europe. A further 759 properties comprising 1.3 million square meters face the same restriction if the 2031 EPC B threshold is enacted. The deadline is real, but not every non-compliant asset presents a viable repositioning case—planning, construction and stabilization typically span five to seven years, and for larger or more complex assets the timeline is tighter still. The opportunity exists, but it requires active identification: specific assets, in specific locations, where the refurbishment economics and entry pricing converge.
Figure 4: London office EPC compliance status, % of properties, 2026
London provides the most granular evidence base, but the underlying dynamic—compliant stock contracting, non-compliant stock repricing and a regulatory deadline creating the entry point—is consistent across Paris, Amsterdam and Munich, each at a different point on the same curve.
Conclusion
Our analysis points consistently in the same direction: the supply of genuinely investable, compliant office space across key European markets is contracting, while demand from occupiers shows no sign of abating. Acquisition pricing has not yet fully reflected the compliance liability embedded in secondary stock—the opportunity exists precisely because that adjustment is still underway.
The repositioning opportunity is equally real but requires precision. Investors must identify specific assets in specific submarkets, where acquisition pricing, achievable rents and refurbishment economics converge. Not every discounted non-compliant asset meets that test. Investors who build that distinction into their underwriting will find opportunities that sector-level assumptions alone would overlook.
2 CBRE, Q2 2026, Builder.
3 European Office Sector Outlook 2026: Market Trends & Insights - Hines
4 CBRE Research, Central London Office Market, Q2 2026.
5 Savills Central London Office Market Watch Q2 2026
6 SHB Q1 2026 | London Office Market Snapshot
7 Turner & Townsend, Construction Costs, European Union - GCMI 2026
8 Sluiting dreigt voor één op de vijf Amsterdamse kantoren omdat ze niet duurzaam zijn: ‘Ombouw naar woningen is vaak gunstiger’ | Het Parool
9 Data set filtered from 396,261 certificates lodged 2023–2026 across the full MHCLG register, de-duplicated to one certificate per property by UPRN across the City of London and prime West End submarkets.
10 City of London analysis covers all office properties within the City of London local authority boundary (EC1–EC4, with E1 Aldgate fringe and WC1/WC2 boundary properties). EC4 (banking district/Fleet Street) accounts for 36% of City stock; EC2 (Moorgate/Liverpool Street) 30%; EC3 (insurance district) 25%.
11 Prime West End submarkets defined by postcode: Mayfair (W1J, W1K, W1S), Oxford Street (W1B, W1C, W1D, W1F), St James’s (SW1), Marylebone (W1G, W1H, W1U, W1W), Soho/Fitzrovia (W1T, WC2). Peripheral Westminster postcodes (Paddington W2, Regent’s Park NW1/NW8 and others) excluded to focus on the prime core investment market. All 3,322 properties deduplicated by UPRN to most recent lodged certificate.