Built on Infrastructure
Infrastructure Quarterly: Q3 2026
October 13, 2026 10 Minute Read Time

Introduction
Author
Head of Infrastructure Research

Author
Associate

AI-driven capital expenditure, energy transition tailwinds and strong institutional demand have sustained the momentum in private infrastructure investment through Q3 2026. Against a backdrop of ongoing trade disruption in the Strait of Hormuz, elevated energy prices, inflation and rising bond yields, the asset class continues to deliver resilient returns anchored by inflation-linked, contracted cash flows. Power, renewables and digital infrastructure remain the dominant themes driving deal flow and capital formation.
Rapid growth and evolution of the infrastructure asset class is creating a need for structured educational frameworks. In this issue, we feature a Q&A with the Chartered Alternative Investment Analyst (CAIA) Association on its Infrastructure Microcredential, which is designed to help investors better assess infrastructure investment opportunities and articulate their role in diversified portfolios.
Market performance
Consistent returns across a challenging cycle
Geopolitical instability continued to dominate headlines in the third quarter of 2026. However, the global economy demonstrated resilience supported largely by AI-driven capital expenditure and strong corporate earnings. These tailwinds drove outperformance of public equities, which returned 22.8% over one-year through Q2 2026 (Figure 1). The returns were heavily dominated by a handful of technology companies and investor confidence oscillated with each earnings release.
The MSCI Global Quarterly Private Infrastructure Asset Index delivered a one-year total return of 12.2% through Q1 2026, gross of fees, in line with long-term returns and reinforcing the role of private infrastructure as a portfolio stabilizer across market cycles. An additional infrastructure benchmark, Cambridge Associates Infrastructure Fund Index, reports returns net of fees and is weighted towards higher risk strategies. Over the past one-year period ending in Q1 2026, core and core-plus infrastructure delivered 10.4%, outperforming value-add strategies, which delivered 7.9%, net of fees.
Rising development input costs due to higher financing rates and exit timing in a more selective secondary market have weighed on returns for higher risk strategies. Core and core-plus remain relatively insulated given their contracted and stabilized yields.
Figure 1: Infrastructure, bonds and equities annualized total returns, %
MSCI recently expanded its Global Quarterly Private Infrastructure Asset Index to cover more than 900 assets with over $400 billion in equity value. Figure 2 illustrates how the asset class has changed rapidly over the past two decades, from a composition dominated by transport and basic utilities, such as waste and water, toward sectors directly benefiting from the accelerated growth of data demand and the energy transition, namely digital infrastructure and renewable energy. This shift and the convergence of data centers and power capacity require a more disciplined portfolio construction that tactically pursues diversification across market themes.
Figure 2: MSCI Global Quarterly Private Infrastructure Asset Index sector composition, %
Fundraising activity
Interim closes and secondaries signal strengthening fundraising
Fundraising appears to have remained subdued in Q2 2026 when measured by final closes in 2026. However, interim close data of approximately $190 billion year-to-date—nearly three times 2025 levels—suggests increasing capital formation (Figure 3). Target infrastructure allocations for institutional investors continue to rise and now average over 6% in 2026 from 5% in 2023, according to Hodes Weill & Associates’ 2026 Institutional Infrastructure Monitor, implying incremental capital flows.
Figure 3: Infrastructure fundraising, $ billions
Infrastructure secondaries are gaining meaningful traction as an allocation strategy. Secondaries have raised over $10 billion in capital year-to-date in 2026 and now represent 11% of total infrastructure fundraising (Figure 4). The growth reflects both a maturing primary market—where limited partners are increasingly seeking liquidity solutions—and a widening opportunity set as the 2016–2017 vintage years approach their exit windows. This is consistent with the typical lifespan of closed-end infrastructure funds.
Infrastructure secondaries represent only 2% of global private infrastructure assets under management compared to 5% for private equity. Infrastructure has broadly followed private equity’s institutional development plan, and as the market matures, this gap in secondaries penetration is expected to narrow.
Figure 4: Infrastructure secondaries capital raised, $ billions, and share of total fundraising, %
Deals
Investment growth led by greenfield data centers
Private infrastructure deal activity reached a new high in the first half of 2026, with global investment exceeding $800 billion (Figure 5a). Deployment remains concentrated, with half of all investment directed toward North America while digital infrastructure’s market share has grown to 28%.
Power generation and grid infrastructure deals are growing as developers and investors respond to the electricity intensity of the data center build-out. Large-scale acquisitions that closed in 2026 span listed and private infrastructure markets, such as the private-public exit of Calpine Corporation, one of the largest U.S. power generators, and the announced take-private of AES Corporation.
Figure 5a: Private infrastructure investments by region, $ billions
Global greenfield infrastructure investments have doubled over the past two years, representing a step-change in capital committed to new-build infrastructure (Figure 5b). Data centers account for half of total greenfield transaction volume, driving a disproportionate share of this greenfield growth. Landmark transactions illustrate the scale: the Shackelford data center campus in Texas is a 1.4 gigawatt (GW) deal estimated to cost over $25 billion and spanning 3.7 million square feet.
Figure 5b: Private infrastructure investments by investment type, $ billions
Sector insights
Power and utilities
Increasing power demand driven by electrification, data center growth and new sources of demand, continues to support robust investment in flexible generation and grid infrastructure. Utilities are expanding renewables, battery storage and co-sited data center solutions as means to achieve high single-digit earnings-per-share growth through 2030.
Weather patterns, such as the extreme heatwaves in Europe over the summer, are driving structurally higher demand for air-conditioning, which will further increase power usage and the need for batteries that can meet swings in peak demand.
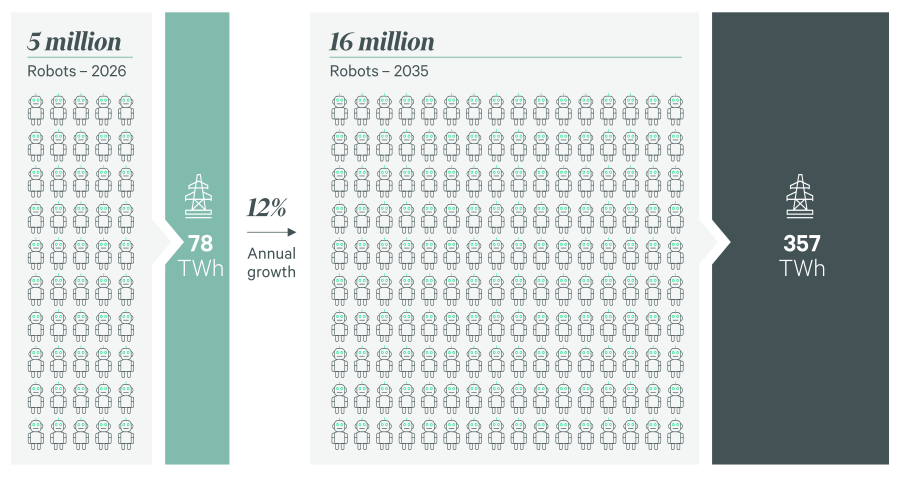
The scaling of robotics technology will add a further layer of baseload demand. The global operational fleet of robots is expected to grow 12% annually (Figure 6), driven by structural labor shortages, rising labor costs and rapid advances in AI capability. However, current grid capacity planning models have yet to fully incorporate this additional demand, which supports further potential growth of the power sector beyond the AI build-out alone.
Figure 6: Global industrial robotic market growth
Renewables
Renewables remain a pillar of infrastructure allocations, accounting for more than 40% of the deal count to date in 2026. The investment case is supported by structural demand from data center operators seeking long-term power purchase agreements, particularly from renewable energy plants operating in the U.S. Midcontinent Independent System Operator (MISO) and PJM Interconnection (PJM) regions.
Renewable energy continues to hold cost advantages over conventional generation, with levelized cost of energy (LCOE) for renewables below new-build gas, coal and nuclear generation (Figure 7). Wind and solar LCOEs increased in 2026, reflecting higher capital costs, elevated interest rates and broader supply chain repricing yet remain below conventional new-build alternatives. Despite these pressures, the relative economics of renewables remain favorable, supported by the absence of fuel-price exposure, improving supply chain efficiency and shorter deployment timelines.
At the same time, U.S. renewables are being stress-tested by supply chain headwinds. A Federal Communications Commission ban on imports of foreign-made inverters threatens near-term solar photovoltaic (PV) and battery energy storage system (BESS) timelines. While the inverter accounts for a relatively small share of the overall cost, they are critical to the operations of both solar PV and battery storage, as they control the flow of generated and stored electricity into the grid.
Figure 7: Levelized cost of energy comparison, $/megawatt-hours (MWh)
Digital infrastructure
AI adoption and hyperscale workloads continue to drive non-cyclical demand for secure, scalable infrastructure. Robust activity from AI startups, neocloud providers and hyperscalers has pushed vacancy rates to record lows in some of the top U.S. data center markets. Development economics of data centers also remain attractive, with Green Street pointing to stabilized net operating income (NOI) yields on cost ranging from 9% in core U.S. markets to 12% in next-tier U.S. markets.1
However, the development process faces increasing complexity and challenges. Sufficient power and grid access remain the key constraints for new development; grid connection delays and rising power costs are affecting asset delivery timelines across Europe and North America. Some projects in the U.S. have faced delays and cancellations due to moratoriums and community opposition related to their energy and water consumption.
With the rollout of more powerful AI models, cybersecurity risks are increasing and the regulatory landscape is diverging. The U.S. leads G20 nations with 25 AI-related bills passed into law between 2016 and 2025 (Figure 8). Recently, the U.S. administration has shifted to reducing AI-specific regulatory constraints at the federal level while the states have passed a record number of AI-related legislation. Leading AI companies have publicly called for greater regulatory oversight, citing the pace of technology change as a systemic safety risk. The future of AI winners may be determined not by technology leadership alone, but by their ability to navigate an increasingly fragmented regulatory environment.
Figure 8: Number of AI-related bills passed into law in G20 countries, 2016-2025
Transport
As capital crowds into digital infrastructure and power, transport presents a tactical opportunity with less competition for deals, a wider range of entry points and the potential for diversification. Recent infrastructure deals feature availability-based assets with limited volume risk (interregional and city rail lines, buses and the leasing of rolling stock) and volume-based models, such as toll roads, airports and ports.
Geopolitical headwinds have not impacted the prospects for airports and ports as much as feared. Global air passenger traffic grew again in July, increasing 0.2% year-over-year (Y-o-Y) after three consecutive months of contraction triggered by the Middle East conflict (Figure 9). Maritime has faced significant rerouting to avoid the Strait of Hormuz, which has driven shipping delays but increased freight costs; vertical integration and network diversification are also enhancing the resilience of carriers and port operators.
The long-term investment case for transport assets is anchored in decarbonization. The European Commission has set targets to double high-speed rail traffic by 2030 and triple it by 2050, with more than 100 European cities committed to climate neutrality by 2030. This goal creates a substantial pipeline of rail investment opportunities, as governments direct private capital toward reducing dependence on short-haul aviation.
Figure 9: Air passenger traffic Y-o-Y change, in revenue passenger kilometers (RPK)
Q&A
Q&A with Steven Novakovic, Managing Director, Educational Programs at CAIA Association
Steven Novakovic, Managing Director, Educational Programs at CAIA Association, discusses the Infrastructure Microcredential and the knowledge gained from completing the course. For more information about the programs CAIA offers, please visit https://caia.org/educational-programs.

What industry developments triggered CAIA to initiate the Infrastructure Microcredential?
Following the pandemic, infrastructure began to separate itself within the real assets space as a true portfolio diversifier. Historically known as a reliable source of income, low volatility and capital preservation, infrastructure is now showing greater versatility and range. With a large global need for infrastructure investment, allocators see that infrastructure can provide growth in addition to income. Investor surveys regularly highlight infrastructure as a strategy that allocators are looking to grow their exposure to in the coming years.
Tell us a bit more about the content and how participants can benefit from taking the course.
The Infrastructure Microcredential provides a comprehensive, in-depth exploration of infrastructure as an asset class, covering sectors, investment styles, asset development stages and global markets. Participants gain a strong foundation in the defining characteristics of infrastructure assets, the various financing structures and access points, and historical performance and risk-return dynamics. The program also emphasizes practical portfolio applications, helping participants understand how infrastructure can be evaluated and incorporated alongside other asset classes. By the end of the course, participants are better equipped to assess infrastructure investment opportunities and articulate their role in diversified portfolios.
Is the course open only to CAIA certificate holders?
The Infrastructure Microcredential is designed for anyone seeking a comprehensive introduction to infrastructure investing. It is well suited for students and early career professionals building foundational knowledge, as well as experienced practitioners looking to deepen or formalize their expertise. Participants do not need to be CAIA Charterholders to enroll. The program is intentionally accessible to a wide audience, reflecting CAIA’s commitment to delivering relevant, practical education across the investment profession.
Conclusion
Private infrastructure enters the second half of 2026 with structural tailwinds intact. Power, energy transition and digital infrastructure continue to lead capital formation and return generation, while transport and utilities provide diversification and stable income. Near-term risks, including elevated inflation, policy shifts and community opposition to data center developments, require active management but do not alter the long-term investment thesis.