Portfolio Allocation
A New Era of Portfolio Allocation with Real Assets
May 21, 2024 7 Minute Read Time

This perspective is part of our Anchoring Your Portfolio with Real Assets series.
Real assets have a proven track record of delivering inflation protection, liability matching cashflows, and stable income-based returns that have a low correlation to those generated by equity-orientated portfolios. All qualities that are increasingly relevant in today’s environment of higher inflation, higher rates, higher macro volatility and higher geopolitical instability.
The prolonged 30-year period (1992-2022) of low inflation and falling interest rates, the absence of large-scale global conflicts and increasing globalization has ended. With higher interest rates to retrenching globalization, the risk profile has shifted. As a result of these structural changes, a review of the traditional 60/40 equity/bond approach is timely. We believe that consideration of a new strategy that protects against inflation and delivers and generates reliable cash flows by creating a portfolio with an equal split among equity, bonds and real assets should be explored.
Putting the Real into Real Assets
By definition, a real asset is one that is tangible—it can be physically touched. It follows that real estate, infrastructure, and commodities all qualify as real assets. However, not all real assets categories provide the same benefits to a portfolio and would, therefore, not be appropriate to a portfolio split equally between bonds, equities and real assets. Protection against inflation, diversification away from equities, generation of an income-based return that does not come at the expense of total returns and liquidity are the factors that investors seek from exposure to real assets.
The below graph highlights the key qualities required and how they relate to five different types of real assets:

Although the benefits of adding real assets, such as real estate and infrastructure to a portfolio are already widely known and why institutions globally have significant exposure to the asset class, the graphics below highlight the varying degrees of exposure.
Real assets allocation by geography and investor type

Canadian public pension plans have a relatively high exposure to real assets (primarily real estate and infrastructure) at 22%. The high level of exposure is due to many fully funded pension schemes in the country that have invested in real estate and infrastructure given the stability of returns and inherent inflation protection, which can match a pension fund’s long-term liabilities. At 21%, Europe, excluding the U.K., also has a relatively high weighting to real assets although achieved through investments in real estate as opposed to infrastructure. European pension plans are less exposed to infrastructure’s higher income returns and inflation protection. U.K. endowments and foundations, with a 27% exposure to real assets, is primarily achieved through real estate.
Real assets, therefore, already account for a significant proportion of institutions’ portfolios, but not yet equal to one-third of portfolios. The table below highlights that the more U.S. pension funds invested in real assets over the 10-year period through September 30, 2023, the higher the risk-adjusted returns that were generated:
Trailing 10-year through September 30, 2023
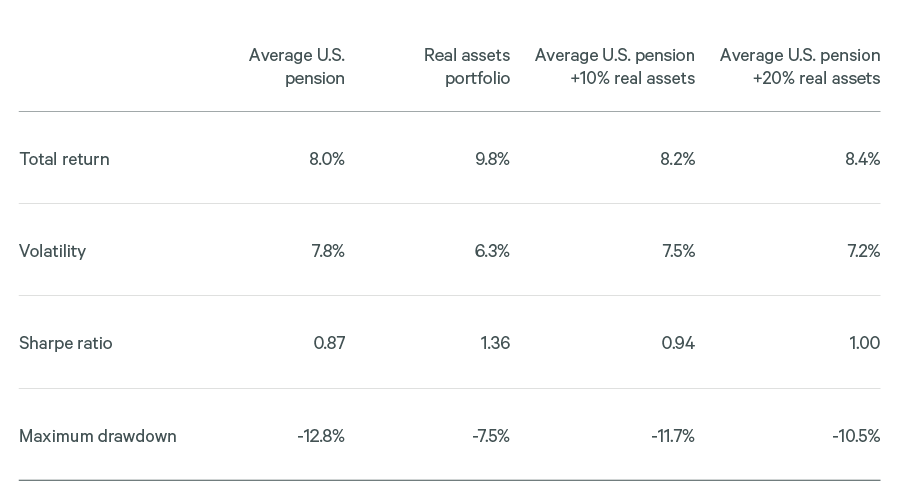
With as little as 10% of their portfolios invested in real assets, U.S. pension plans would have enjoyed higher returns, seen lower volatility, and suffered smaller maximum drawdowns over the last 10 years compared to the average U.S. fund. A 20% weighting to real assets would have generated even higher returns, while at the same time resulted in lower volatility and maximum drawdowns.
The same is true for 60/40 portfolios—adding exposure to real assets generates higher total returns and lower volatility, as highlighted in the graphic below:
Trailing 10 years through September 30,2023
.png?rev=5fc8f59bdbe24e27b95758f14706113a)
Higher returns and lower volatility may have been preferred over the past decade in which bonds and equities both enjoyed relatively strong returns but are now required in today’s macro-environment.
Paradigm Shift
Low inflation and interest rates, relative peace and globalization helped to foster an environment in which individual asset class returns became more closely correlated. Against such a backdrop, traditional 60/40 portfolios and portfolios with highly concentrated equity-like risk performed well. Despite bonds being in the mix primarily to protect portfolios against market volatility, the 40% weighting positively contributed to performance as bonds were also beneficiaries of the low inflationary and falling interest rate environment. The correlation between bonds and equities, therefore, increased, which worked when inflation was low.
Typically, inflation hurts fixed coupon, higher duration bonds. Floating rate, lower duration bonds, such as those commonly used in real estate credit, can benefit from rising rates as the attached coupons increase accordingly. When inflation is rising, fixed coupon bond prices tend to fall and yields rise to compensate investors. In such an environment, however, bonds are, less able to protect against market volatility. In 2022, the year when inflation took off, returns for the average 60/40 portfolio fell by 16%.1
As the Bank for International Settlements’ article, Markets adjust to "higher for longer," states: “Amid a generalized increase in the volatility in fixed income markets and in sync with the inflation surge, the correlation between equity and bond returns has turned from negative to increasingly positive. A departure from the negative correlation between equity and bond returns, the typical configuration for the past two decades, weakens the diversification in the classical long-only asset allocation strategies of pension and investment funds. Specifically, it undermines the role of bonds as a hedge for the portfolio's equity portion.”
The role of bonds as “a hedge for the portfolio’s equity portion” is needed more than ever today as the macroeconomic and geopolitical environment we are confronted with looks increasingly like the pre-1992 era of high inflation, high interest rates, global conflict and tension as well as high levels of protectionism.
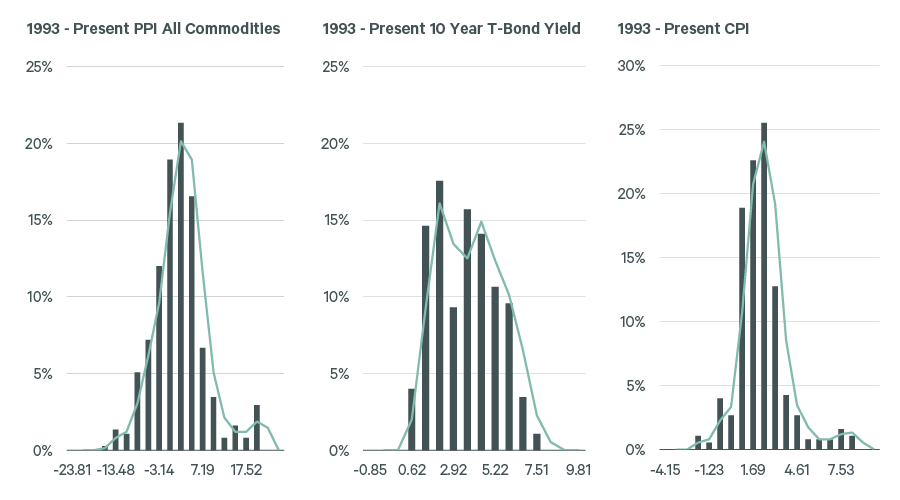
Volatility tends to increase in such an environment. As the graphic below highlights, the more uncertain environment of the pre-1992 era created more tail risks:
Geopolitical peace dividend created normalized outcomes (1993 to 2022*)
Geopolitical uncertainty creates tail risks (1960-1992)
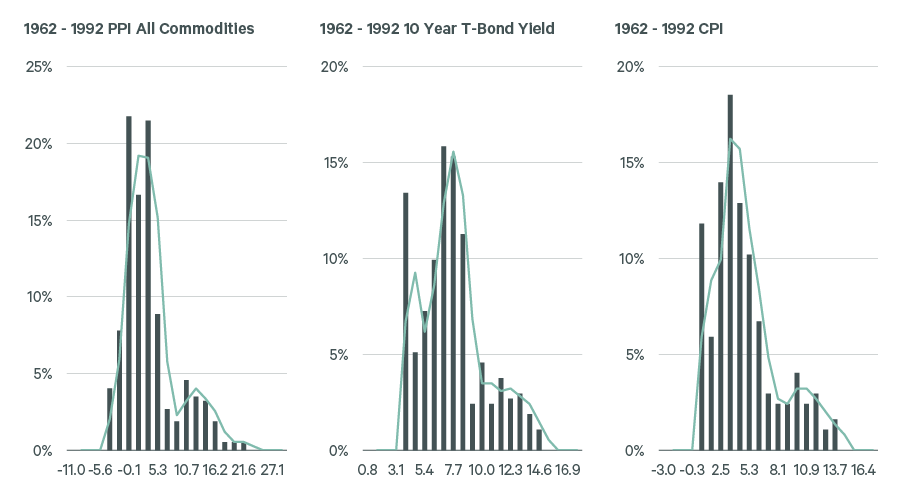
Source: CBRE IM. as of 2022. Oxford Economics. For illustrative purposes only. Past performance is not indicative of future results. There can be no assurance any comparable results will be achieved or that any return objectives will actually be realized. For illustrative purposes only.
It also resulted in extended periods in which equities failed to keep pace with inflation:
10-year Rolling Periods CPI Out-Performed Stocks (S&P 500)

If we are moving to an era similar to the pre-1992 years, then the 60/40 portfolio, along with highly concentrated equity-like risk portfolios, that have been the standard strategies employed in recent decades will likely struggle. Further protection against market volatility will be required—protection that can be provided by real assets.
How to Build Exposure to Real Assets
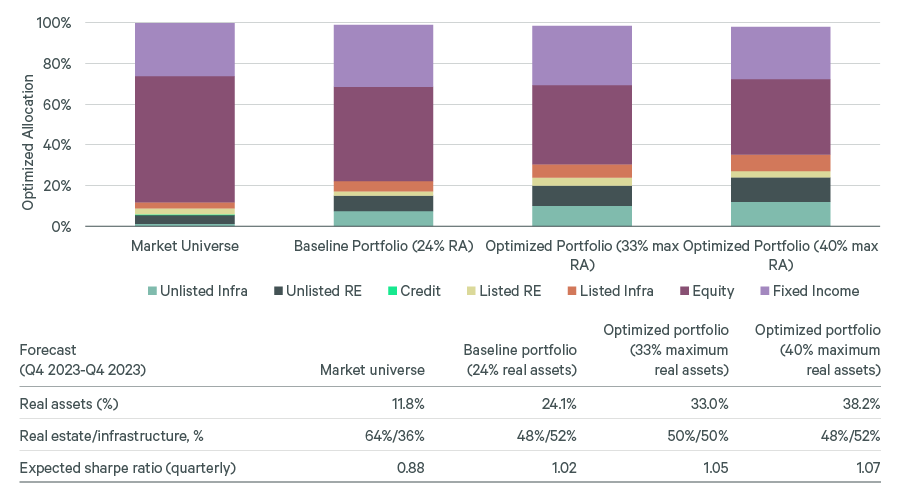
A first step to increasing the level of real assets investment to one-third of a portfolio is to divide the real assets exposure roughly equally between real estate and infrastructure. Not only does this split the challenges associated with building a one-third weighting equally between real assets and infrastructure, it also enables a portfolio to benefit from having a diversified exposure to real assets.
As the below graphic shows, splitting real assets exposure equally between real estate and infrastructure generates a Sharpe Ratio of above one. The Sharpe Ratio measures the risk-adjusted return of an investment or portfolio—a ratio of above one represents an acceptable performance when compared to that of a risk-free investment such as government bonds.
Optimized allocations based on 10-year expected risk and return (Real assets in green)
Returns in USD as of Q2 2023. Sources: Equity: S&P 500, Corporate Bond: U.S. Aggregate Credit - Corporate - Investment Grade (A). Structured Bond: Bloomberg U.S. Universal Structured Credit. Government Bond: Bloomberg U.S. Government. High Yield Bond: Bloomberg U.S. Aggregate Credit - Corporate - High Yield. Listed Real Estate: NAREIT All Equity REIT Index. Unlisted Real Estate: NCREIF ODCE, de-smoothed by CBRE IM. Unlisted Infrastructure: Blend of Cambridge Associates Global Infrastructure Index and EDHEC infra 300 index, equal weighted, netted by CBRE IM. Listed Infrastructure: FTSE 50/50 Core Infrastructure index. Real Estate Credit: Giliberto Levy L-2 index, custom selection by CBRE IM. Private Credit: Cliffwater Direct Lending index. For illustrative purposes only. There can be no assurance any targets or business initiatives will occur as expected. Forecasts are inherently uncertain and subject to change. For illustrative purposes only. Based on CBRE Investment Management's subjective views and subject to change. There can be no assurance any targets or business initiatives will occur as expected. Forecasts are inherently uncertain and subject to change
A review of real estate and infrastructure follows:
Real Estate
The majority of institutional portfolios are likely to have exposure to the asset class already. A closer look at a portfolio’s real estate holdings may reveal a reset is required in terms of strategy, the types of assets held and how exposure is gained.
Strategy: a key question is whether a portfolio’s real estate strategy and existing assets held are aligned with the portfolio’s risk profile and objectives. Different risk profiles and objectives require different strategies. A low-to-medium risk portfolio for example targeting net returns of between 6%-12% would typically deploy a core/core+ strategy; for a medium-to-higher risk strategy, targeting net returns of 14%+, a value-add strategy could be considered. Once a strategy is in place, the next step is picking the right solution to execute it—different solutions work better for different strategies. For example, closed-end structures work better for value-add strategies: open-end fund structures are better for core and core+ strategies.
Sectors: Some sectors benefit from long-term structural drivers and are better placed to deliver the stable, long-term income returns required of real assets exposure. Other sectors less so, or perhaps are more exposed to changes in the economic cycle.
Logistics, as an example, benefits from multiple growth drivers such as the rise of e-commerce and the reconfiguration of supply chains. As a result, vacancy rates have been generally low and rents have risen as supply struggles to match demand. Residential, both mainstream and niche, have benefitted from a supply/demand imbalance with supply constrained, particularly for high-quality affordable homes for low-middle income workers in major cities in developed markets globally. Demand for single-family residential and senior living remains strong.
Individual assets: Investing in the right types of properties is critical. Strong demand for logistics assets is largely centered on modern facilities that are equipped to meet occupiers’ evolving needs. Modern logistics facilities offer such features as floorplates that are compatible with robotic packing and roofs that can accommodate solar paneling. Older vintage assets may need to replace various building features if feasible to capture demand. There is also greater demand for buildings with more sustainable features to meet regulations and/or net zero targets.
Gaining exposure: Dislocation in private markets due to reduced liquidity or forced sales by funds with redemption queues or by developers in need of recapitalizing can result in attractive assets being acquired at attractive prices. From time to time, similar opportunities can be found in the listed space in times of heightened market volatility and closed-end funds can trade shares at substantial discounts to the value of the underlying assets. Market selloffs can generate opportunities to gain exposure to high-quality properties in preferred sectors at attractive prices.
In sectors where there is chronic undersupply and where only limited assets are available, scale can be achieved through development. One sector where it can be challenging to gain scale is the single-family residential sector. Build-to-rent offers a solution that not only helps increase a portfolio’s exposure to real assets but also contributes to solving a major societal problem—a shortage of housing.
Taking advantage of real estate opportunities through the correction and recovery phases of the cycle: Typically, corrections and recoveries can be broken down into four phases.
- Phase one: The early period of initial shock and public market repricing, which can lead to listed REITS trading at material discounts to net asset value.
- Phase two: Sentiment bottoms as a broader repricing spreads to private markets which in turn can lead to forced sellers, attractive pricing in secondary units in private funds as well as listed REITs continuing to trade at discounts to NAV.
- Phase three: Restructuring catalysts can generate recapitalization opportunities through, for example, the need for existing owners to secure fresh debt and/or equity.
- Phase four: Market normalization when fundamental growth resumes across the board.
Infrastructure
As with real estate, achieving scale in infrastructure exposure can, on the face of it, appear challenging, a case of too much money chasing too few assets. As with real estate, however, there are solutions that can overcome this.
If you can’t buy it, build it: One way to solve the issue of limited opportunities to gain or increase exposure to infrastructure is to build assets, a solution that not only delivers exposure to the asset class but also helps meet societal needs.
Focus on next generation infrastructure subsectors: Clean technology and digital real assets are next generation infrastructure subsectors. Clean technologies include sustainable transport, power grids as well as renewable energy generation. It is an area that benefits from significant government backing—clean transport including rail and EV charging networks account for the majority of the U.S. Government’s Build Back Better fiscal stimulus. In addition, the European and U.S. energy storage and hydrogen production sectors benefit from strong government backing and policy support.
Digital real assets is another area benefiting from strong support, this time from continuing growth in demand for cloud computing and AI. Assets include towers, demand for which is being driven by wireless traffic growth and carrier spending globally. Data centers are also attracting interest from the private sector owing to constrained supply in the face of elevated demand growth.
Go global: Different parts of the world develop in different ways and at different paces. Because of this, going global has the potential to increase the opportunity set available to investors looking to gain exposure to infrastructure. Overseas markets may also enable investors to invest in high-growth areas that may not be of sufficient scale in an investor’s domestic market. Regional variations can also be capitalized on to help smooth out the cycle—certain countries and regions can be more advanced along the economic cycle than others, offering opportunities to take advantage of depressed prices.
Being cycle aware can help inform which strategies/tactics to deploy to acquire infrastructure assets in preferred sectors.
Costs
High annual operational costs eat into the returns generated by real estate and infrastructure just as they do for all asset classes.
Compared to bonds and equities, the costs associated with real assets tend to be higher on a standalone basis, although transaction costs can be lower due to reduced levels of turnover. When compared to other alternative asset classes, such as private equity and hedge funds, however, real assets are no outliers. According to the Callan Institute’s 2023 Investment Management Fee Study, in 2023 institutional investors were charged average fees as a percentage of NAV of between 40 and 68 basis points (bps) for actively managed equity mandates. The equivalent figures for fixed interest were lower, between 19 and 31bps.
By contrast, institutions paid an average fee of 68bps for private real assets and 58bps for all liquid real assets, higher than bonds and equities but considerably lower than those charged by hedge funds—in 2023 these came with an average fee of 107bps.
It is possible to reduce the overall costs of investing in real assets by utilizing the full spectrum of available structures—listed, closed-end and open-end funds. Compared to closed-end, open-end funds tend to have lower base fees. Also, smaller investors can gain exposure to real assets at a lower cost by utilizing a global indirect platform that delivers unconstrained flexibility to invest in a wide range of ownership structures including funds. By pooling commitments, investors can benefit from tiered fee schedules that see fees fall as scale grows. Even though costs are due to a multi-manager to manage the underlying funds, on a net basis, the investor is still likely to receive an attractive return.
A one-third/one-third/one-third bond/equity/real assets strategy may be a departure from the recent past, but the building blocks required to put a portfolio in place in a cost-effective way exist.
Why Now is a Good Time to be Building Real Assets Exposure
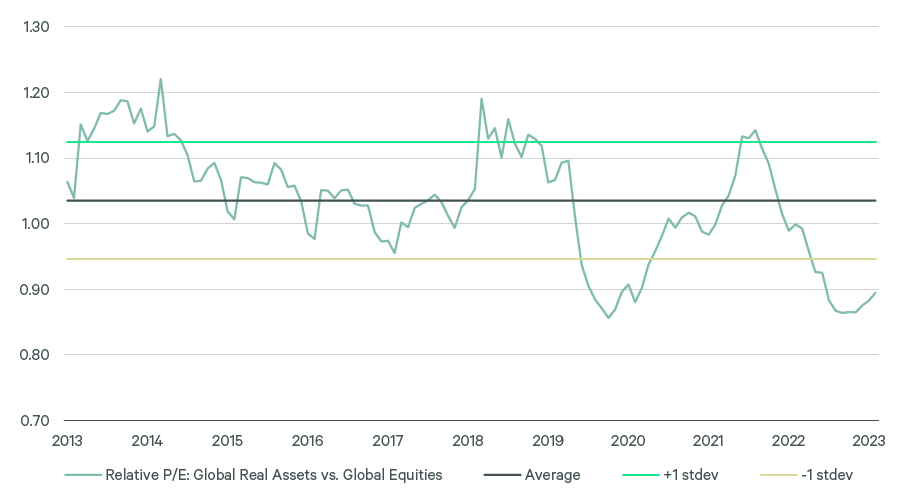
Securing an attractive entry price is a key driver of returns for any asset class. Prices are determined by a wide range of variables—demand and supply, liquidity, etc. Timing is also a key factor. From time-to-time markets can generate buying opportunities at attractive valuations when taking a long-term view. Today’s markets have the potential to be one such buying opportunity. As the graph below shows, on a forward multiple basis, core listed real assets are looking attractive relative to global equities.
Relative 12-month forward P/E Multiples (Global Real Assets vs. MSCI World)
Summary
2022 saw traditional 60/40 portfolios fall heavily. Although 2023 saw these portfolios recover most of the lost ground, the last two years are a harbinger of more volatile times to come. The world today is arguably looking more like the pre-1992 era, an era marked by inflation, heightened geopolitical tension and protectionism. History suggests the period ahead will be punctuated by elevated levels of volatility.
As 2022 and 2023 have shown, 60/40 balanced portfolios will not be immune to volatility. A portfolio split equally between equities, bonds and real assets can help lower volatility and minimize drawdowns. Crucially, this does not come at the expense of returns. Indeed, the stable income-based returns and inbuilt protections against inflation that real assets offer would have enhanced the returns of U.S. pension funds over the last decade. Superior returns and lower volatility both call for a rethink of what a balanced portfolio ought to look like. It’s time to consider a portfolio that is equally split between equities, bonds and real assets.
1 Equity: S&P 500, Corporate Bond: U.S. Aggregate Credit - Corporate - Investment Grade (A). Structured Bond: Bloomberg U.S. Universal Structured Credit. Government Bond: Bloomberg U.S. Government. High Yield Bond: Bloomberg U.S. Aggregate Credit - Corporate - High Yield. Listed Real Estate: NAREIT All Equity REIT Index. Unlisted Real Estate: NCREIF ODCE, de-smoothed by CBRE IM. Unlisted Infrastructure: Blend of Cambridge Associates Global Infrastructure Index and EDHEC infra 300 index, equal weighted, netted by CBRE IM. Listed Infrastructure: FTSE 50/50 Core Infrastructure index. Real Estate Credit: Giliberto Levy L-2 index, custom selection by CBRE IM. Private Credit: Cliffwater Direct Lending index.